
https://m.youtube.com/watch?v=4jAZuNwopIM&feature=youtu.be
All posts by thenewbostonteaparty
THE STORY BEHIND THE STORY
CLICK BELOW (the ultimate gaslight)
If you need any further proof that the mainstream media is absolute trash, may I introduce you to Susan Dominus from the New York Times Magazine. Earlier this week, Susan delivered a glowing, sympathetic framing of one of the November 2020 election’s most notorious villains: Eric Coomer.
In her August 24, 2021 fictional short story, He Was the ‘Perfect Villain’ for Voting Conspiracists, Dominus paints an interesting, surprisingly honest at moments, picture of Mr. Coomer. She shares:
“He was a gifted programmer, known to be serious about his work but informal about almost everything else — prone to profanities, with a sense of humor that could have blunt force.”
“…traveled around the world for competitive endurance bike races, would have blended in on the campus of Google, just one in a crowd of nonconformist tech types.”
“…he stood out for the full-sleeve tattoos on his arms (one of Francis Bacon’s “Screaming Popes,” some Picasso bulls) and the half-inch holes in his ears where he once wore what are known as plugs.”
Eric is just an alt-personality, a non-conformist type — but he’s super gifted at programming. The kind of guy you’d find at a big tech company (do you feel your confidence and trust levels rising yet?)
Deeper into the article, we get to understand a bit more about Mr. Coomer’s past and how he came to be involved in our elections. And, I’m not gonna lie, this is my favorite part of this piece by Dominus:
“As a teenager and into his 20s, he considered himself a skinhead, but he was aligned with a faction who were opposed to racism. ‘To me, being skin is being proud that you have a shaved — at least short — hair,’ he wrote in 1991.”
As someone who also grew up in the 1990’s – with a front row seat to the decade of race wars in Atlanta and other cities – I feel confident in saying that literally no one in the 1990’s called themselves a skinhead without proclaiming pride in white skin. The two were synonymous.
Was Coomer the inspiration for Remy?
To me, it sounds like Coomer is admitting he was a skinhead, but trying to associate that more with the 1990’s punk rock and straight-edge movements, which were in full swing during the decade. Rewriting history.
Dominus goes on:
“In 2004, at age 34, he wrote on a climbing message board about his struggles with heroin and cocaine and how much they had damaged his life. By then, he was on the verge of bankruptcy, had lost his marriage and had ended up in prison after being charged with several counts of driving under the influence. ‘Another bout of dry heaves racked my body as I lay on the cold cement floor of the jail cell,’ he wrote. ‘Jail is no picnic under the best of circumstances — being in jail while withdrawing from heroin is absolutely the worst I can imagine.’”
So, in 2004, Coomer was withdrawing from heroin in jail because he was caught driving “under the influence,” presumably the influence of heroin since he was withdrawing from the substance while in jail. Does he treat our election security with the same rigor he treats road safety?
To summarize where we are in Coomer’s journey, he was a skinhead who was addicted to heroin and blow, withdrawing in jail due to “several counts” of driving under the influence. I think the author here is trying to paint this as Coomer’s “bottom” in his struggle with addiction. And, I swear, I am not removing anything — this is the actual transition Dominus uses:
“In 2005 he managed to stop using heroin for good.”
Wow, that’s nice! Well done, Eric. What’s your secret?
“‘I stayed with a friend for a week and told him to take my shoes and my wallet,’ Coomer told me.”
No steps or anything? Just taking your shoes off? Hey addicts, lose the shoes and you’ll be healed!
“Three months later, while he was still in withdrawal, he received a cold call from someone asking if he would consider doing programming work for Sequoia, the voting-machine company whose assets Dominion purchased five years later.”
– SUSAN DOMINUS, CREATIVE WRITER AT THE NEW YORK TIMES MAGAZINE
A cold call. He got a cold call. This junkie’s fairy godmother waved her magic wand and all of a sudden a voting machine company — an industry that should be driven by public trust, whose primary metrics should be accuracy and transparency — reached out and gave him the opportunity of a lifetime. A set of glass slippers and a pumpkin carriage to legitimize him.
What is unclear is what this company’s public vetting policy was at the time, and who said (after vetting Coomer three months into sobriety), “Let’s go with the heroin addict that has the criminal record. He seems like a smart business decision given that our buyers are state and local governments, and our business is integrity and transparency.”
Dominus paints this as the moment Coomer found his calling in life. She continues:
“Soon, he was channeling the same obsessive focus he had for climbing [read: heroin and sexual battery fantasies, but we will get into that shortly] into the voting-machine business, its obscure state laws and county regulations, its competing and complicated demands for privacy, security, access and verifiability. ‘I fell in love with the election business,’ Coomer said. ‘There’s no money in it [literally LOL], and you only ever hear from people complaining about what went wrong. But it felt meaningful.’”
Awwww. He found his purpose. He took all the energy and effort that he previously put into doing heroin and driving around while high on heroin and sweating in jail for driving around while high on heroin, and he channeled that into the noble cause of securing our most sacred institution: The Vote.
Does anyone actually believe this? Dominus provides no receipts, spins yarn about the poor little junkie and his sad, sad tale, and sets up the evil Joe Oltmann — and we’ll get into that in my next piece — as the man who ruined Eric’s life. In a bolded call out on the NYT release of this “article” — which, honestly, should have “Advertorial” written across the top and a link to Dominion’s website and Coomer’s CashApp in the footer — Dominious says:
“Coomer had given conspiracy theorists a valuable resource, a grain of sand they could transform into something that had the feel — the false promise — of proof.”
– SUSAN DOMINUS, CREATIVE WRITER AT THE NEW YORK TIMES MAGAZINE

welcome to my world
Articles. Musings. Poetry. Maybe a script or two.
I write all kinds of things about all the things. I write for the global corporate capitalists (and communists) by day, as a corporate propagandist and master chaos organizer. Here I write about the things I want to write about. The important things. The hard realities and hate facts. And God, Family, Freedom. Like I said, important things.
I love all forms of discourse, debate and feedback. Please drop me a comment here, an email (ashe@asheinamerica.com), or hit me up on Telegram, Parler, or any of the many secure messaging apps. Basically, if I am on socials, I’m @asheinamerica.
- the ultimate gaslight: susan dominus, eric coomer, & the mainstream fairy tales of the new york times
If you need any further proof that the mainstream media is absolute trash, may I introduce you to Susan Dominus …
- janet and the betas release their new album: “we’re voting for this but it’s not our fault“
The Mesa County commissioners meeting just ended after fiery public testimony from the people of Mesa County put the commissioners …
- the colorado coup is nearly complete, and dominion is right in the middle of it (yes, really)
Since I posted The Tale of Tina Peters last week, the situation in Mesa County has kicked into high gear. …
- the tale of tina peters, and the dark days ahead for whistleblowers
Tina Peters is a gold star mom, a cancer survivor, a public servant, and a courageous whistleblower. And the rapidly …
- “you should consider becoming whistleblowers” — my public message to jena griswold’s staff
Note: I gave this testimony at the Secretary of State’s Hearing on the “emergency” rules for Colorado elections, August 3, …
- they think they can play GOD – because they can
I wrote this in July 2020. I never published it before. I was just waking up to the reality of …
- jena griswold panics and bans independent auditors from colorado: over the target
DENVER, JUNE 17, 2021. Earlier today, Colorado Secretary of State Jena Griswold claimed executive action and declared a state of …
- we are all terrorists now
I usually try not to make this space too personal, but I am going to full blog on y’all for …
- it’s time for new thinking
First let me apologize for taking so long to congratulate Kristi Burton Brown on her GOP Chair win! It’s still …
- free america
Our culture’s quickly burning, Society aflame, And those who seek to quench her, Get floggings, public shame. Hysteria and fear …
BLAME TRUMP
To quote Meghan McCain, McCain has been out outspoken critic of Biden’s throughout the turbulent withdrawal from Afghanistan. , saying he’s “unfit to lead” and comparing the president to “Jimmy Carter on acid.”
Winston Churchill, “A nation that fails to honor its heroes, soon will have no heroes to honor.” 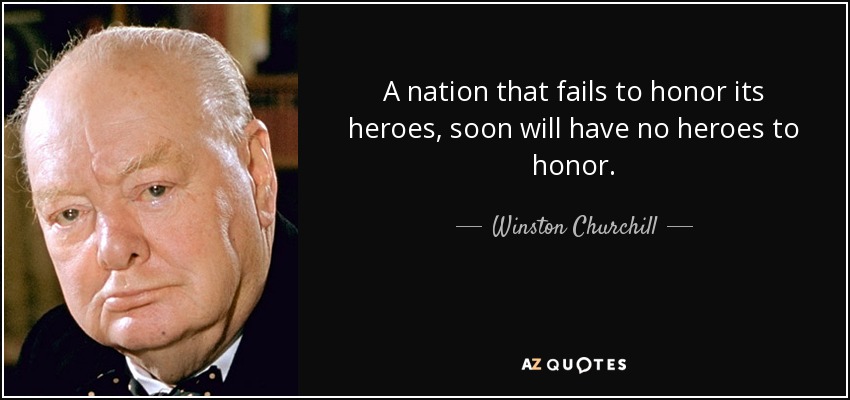
America has seen a destitute invalid blame Trump for his own inadequacies. Remember, Trump indicated that he, if reelected would be out by May 1. Trump was not reelected. Biden then became the Commander and Chief. May 1 passed, this dimwit then went yellow pants. He had no plans. His weak administration decided to extend the date to August 31. And why did he do this? Because the anniversary of 9-11 was upon us. Biden’s handlers closed the Bagram Air base. They did this without any sense of what effect it would have on the plan to vacate Kabul. And we know what happened three days ago. Suicide bombers unleashed their anti-U.S. venom with dispatch. Biden throws up his hands and says, “not my fault.”
"I take responsibility for the decision. Now some say we should have started mass evacuations sooner and couldn't this have been done in a more orderly manner? I respectfully disagree." — President @JoeBiden on the Afghanistan withdrawal pic.twitter.com/uatUObes7S
— Mediaite (@Mediaite) August 31, 2021
Tucker Carlson: (click)Contrition is essential to fixing problems, our leaders don’t have it
go to the following URL to hear more on Tucker
https://www.foxnews.com/opinion/tucker-carlson-leaders-afghanistan-biden-doubled-down
TAKEOVER
THIRTEEN OF OUR HEROES have been murdered by an illegal incompetent president. He did not protect America’s men and women, letting them be blown up by blood thirsty savages. During the receiving ceremony that took place on hallowed ground Biden looked at his watch, wondering if it was time to take a sleeping pill. Our troops, saw the Commander and Chief, who actually despises them, watched in horror as their comrades were blown to smithereens. Not one Democrat shed a tear.
So we present this case to the members of our ARMED FORCES, turn you back on Biden like he turned it on you, give up your tour, your service, your rank and form a NEW ARMED FORCES UNDER CONTROL OF PRESIDENT TRUMP. The real president. This will be a smooth transition. Trump will take the oath, given to him by the Chief Justice of the Supreme Court. Biden will be court martialed, Lock Her Up will be arrested and tried for murder and John Kerry will be executed for spying for the enemy. Laws will be enforced, chaos will be subdued and ANTIFA types will be jailed. America will be great again.
WE CALL FOR THE IMPEACHMENT OF THE BIDEN ADMINISTRATION
We have never seen anything like this fiasco in our 245 year history. Biden and his incompetents retreated from engagement when the GOING GETS TOUGH – putting our soldiers in jeopardy by signaling to the enemy the time of our planned withdrawal. The Taliban cohorts – ISIS got the go-ahead to strike and they did with with vigor. The suicide bomb attack in Kabul saw 13 Americans die on the battlefield.


This is not the time for politics, this is the TIME FOR IMPEACHMENT. Biden is UNFIT TO HOLD THE HIGHEST OFFICE IN THE LAND. Those Democrats that don’t vote to impeach him, are themselves guilty accomplices. Higher-ups in the defense department need to have their heads rolled. They were not prepared for the calamity at hand.
U.S. military vacates main Bagram air base in Afghanistan in the middle of the night. Because of the closure Biden was not able to fly Americans out of Afghanistan before the attack. The Taliban took over the base which consisted of Black Hawks and RPG’s.
Lindsey Graham calls for IMPEACHMENT.
Lindsey Graham repeats impeachment call for former friend Joe Biden
- Republican accuses president of ignoring advice on Afghanistan
- Biden rebuffed Graham in call explaining Trump support
Lindsey Graham has repeated his call for Joe Biden to be impeached over the US withdrawal from Afghanistan, saying the president “ignored sound advice” and has “been this way for 40 years”.
Some observers may harbour doubts about Graham’s sincerity.
The Republican senator from South Carolina was close to Biden when Biden was a senator, a relationship which remained strong when the man from Delaware became vice-president to Barack Obama.
Only six years ago, in 2015, Graham told the Huffington Post: “If you can’t admire Joe Biden as a person, then you got a problem. You need to do some self-evaluation. ’Cause what’s not to like?”
Calling for US forces to remain in the country, to tackle terrorists who killed 13 US troops and as many as 170 Afghans this week, he said: “You cannot break [Islamic State’s] will through drone attacks. You’ve got to have people on the ground hitting these people day in and day out. You can’t do it over the horizon.
“[Biden] deserves a lot of accountability for this. And I’m sure it will be coming.”
Graham is not the only Republican to call for Biden to resign or be impeached but as Democrats hold both houses of Congress the idea is a total non-starter. Attacks on Biden are more focused on seeking to inflict lasting damage before midterm elections next year.
Regardless, Graham told CBS he still thinks Congress should make Biden the fourth president it has tried to remove, after Andrew Johnson, Bill Clinton and Trump.
“I think it’s dereliction of duty to leave hundreds of Americans behind enemy lines, turn them into hostages, to abandon thousands of Afghans who fought honourably along our side, to create conditions for another 9/11 that are now through the roof,” said Graham.
As a senator, Graham was a juror in Trump’s two impeachment trials. He voted against convicting him for seeking dirt on Biden in Ukraine and inciting the deadly Capitol riot.
“Yeah, I think [Biden’s] been derelict in his duties as commander-in-chief,” Graham told CBS. “I don’t think he got bad advice and took it. I think he ignored sound advice.
“And this is Joe Biden being Joe Biden. He’s been this way for 40 years, but now he’s the commander-in-chief. He’s not a senator. He’s not the vice-president. These are commander-in-chief decisions. I think the best you could describe is dereliction of duty at the highest level.”
Rather than challenge Graham about his many changes of heart about Biden, host Ed O’Keefe ended the interview by calling the senator “an erstwhile friend of the president” who “obviously disagrees with him on this”.
After Graham’s call to Biden was reported, Biden told Stephen Colbert: “Lindsey’s been a personal disappointment, because I was a personal friend of his.”
When Race May Not Be Enough
Ivan Ivanovych, American Renaissance, August 26, 2021
When Race May Not Be Enough
Ivan Ivanovych, American Renaissance, August 26, 2021

(Credit Image: © Andriy Andriyenko/SOPA Images via ZUMA Press Wire)
This week, on August 24th, Ukraine celebrated its 30th year of independence from the USSR. In 1991, Ukraine had all the makings of a prosperous European nation: an educated population composed mostly of a homogeneous white ethnic group, an untapped market full of potential, and an abundance of natural resources.
Yet, of all the nations that emerged from the U.S.S.R, Ukraine’s fate has perhaps been the most tragic: a banking collapse, hyperinflation, opaque privatizations, corruption and the hostile oligarchy that emerged as a result, wages unable to keep up with inflation, political instability, and war with Russia.
Ukraine has shown that having a white supermajority is not enough. For while Ukrainians share the intelligence and creativity of Europeans, they lack the social norms — developed over centuries — that enabled their Western counterparts to build successful societies. Ukraine is an extremely low-trust society. This could be attributed to Soviet Communism, but there was low trust before then.
Ukrainian history is plagued by infighting and an inability to find common ground. Ironically, it was the Bolsheviks — hostile to Ukrainian nationalism — who in 1922 founded the first modern Ukrainian state to be recognized internationally (in exchange, of course, for helping to found the USSR).
The fractious Ukrainians were perhaps the nation most hostile to the totalitarian nature of the Soviets, and they paid a high price for it. Millions died in the Russian Civil War of 1917–1922, and in the artificial famines induced by the Communists (most notably the Holodomor genocide of 1932–33), and the Stalinist purges.
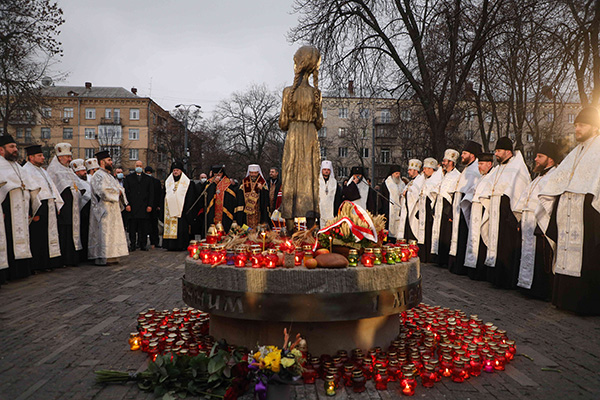 Priests of different Christian confessions serve a memorial service as people lit candles and lay bouquets from ears ang arrowwood to the memorial of Great Famine victims during mourning rally in Kyiv, Ukraine, November 28, 2020. Ukraine honors the memory of the victims of the famines and Great Famine (Holodomor) of 1932–1933 when 4.5 million Ukrainians, including 600,000 unborn children, were starved to death by the Soviet regime. (Credit Image: © Sergii Kharchenko/NurPhoto via ZUMA Press)
Millions more died during World War Two and, inevitably, Ukrainians were once again divided. Some in the west collaborated with the Germans to fight the horrors of Bolshevism, while the majority loyally served the Red Army. Alexander Solzhenitsyn noted that the number of Ukrainians was disproportionately high in the Soviet gulags.
Ukraine is now in the eighth year of a war waged by Russia to prevent, at minimum, Ukraine from joining the EU and NATO. So far, the strategy is working. Russia’s ultimate goal is to fragment Ukraine into two or three nations based on linguistic and religious divides, a strategy which has not yet succeeded.
From a racial perspective, Ukraine’s story is deeply disappointing. Boasting a population of 52 million in 1991, that number has fallen to 44 million and is still dropping. In recent studies, Ukraine has been among the top five countries in the world in terms of rate of demographic decline, ranking alongside Syria and Bosnia and Herzegovina — other war-torn countries. The fertility rate is 1.3 children per woman in 2018, below even Europe’s paltry average of 1.55.
Many millions have emigrated in a massive brain drain. Countless thousands have been trafficked into sexual slavery; Ukrainian women have a worldwide reputation for beauty and submissiveness. In this respect, history is repeating itself. Turks often took Ukrainians as slaves in raids — women for sex and even used men to serve in their armies. Now they come as sex tourists, rent hotel rooms, and pay for services at rates far above what the average Ukrainian can earn in a month. Tragically, many women willingly choose the sex trade because it pays so well.
The medical system is in shambles with the average doctor earning a few hundred dollars a month. Ukrainians call medical personnel, teachers, and professors “enthusiasts” since their only motivation is passion, not financial reward. The government has largely failed to maintain a functioning state — with a decent medical and education system — partly because of rampant corruption that drains the budget.
In the most blatant case in recent years, the government in 2016 had to nationalize the nation’s largest commercial bank, Privatbank, because it was being abused by its partners — Israeli citizens — in a so-called “vacuum cleaner” scheme to send millions of dollars in assets overseas, especially to the US.
The Justice Department is pursuing forfeiture of some of the assets acquired with these funds. In March, it also slapped sanctions against one of the partners — billionaire Igor Kolomoisky — who is under investigation for embezzlement and fraud.
Many think oligarchs are the problem, and justifiably so. These billionaires give practically nothing to charity, and they finance politicians who do their bidding, further fueling corruption. Oligarchs profit from the failures of the state. It’s clear they feel no obligation to improve the life of peasants, unlike even the Russian tsars before them. Perhaps a clue to their indifference is that they share no ethnic ties to the population.
The most notorious oligarch, billionaire Rinat Akhmetov, is a nominal Muslim and Tatar (they were among the people raping and pillaging Ukraine centuries earlier). When the Russians moved into his native Donbass in 2014, Mr. Akhmetov moved to Kyiv and formed a political alliance with another billionaire, Petro Poroshenko, who was elected president that year.

Rinat Akhmetov (Credit Image: © Bernd Von Jutrczenka/DPA/ZUMAPRESS.com)
Mr. Poroshenko is one of only a handful of Ukraine’s oligarchs who can claim Ukrainian blood, but it didn’t count for much. His presidency became notorious for corruption schemes and alleged profiting from the war in the Donbass. He became so disliked among the public that a Jewish comedian, Volodymyr Zelensky, defeated him in the 2019 presidential vote.
Mr. Zelensky has been able to maintain popularity far longer than Mr. Poroshenko, who is Ukraine’s least trusted politician, according to polls. After the US applied sanctions this year against Mr. Zelensky’s main sponsor, Igor Kolomoisky, the president switched his loyalty firmly to the IMF and Western NGOs.
 Volodymyr Zelensky (Credit Image: © Irina Yakovleva/TASS via ZUMA Press)
Of course, these NGOs (sponsored by the usual suspects) only exacerbate the demographic spiral, promoting all forms of toxic feminism and sexual perversity. However, this is one of the few areas in which Ukrainians benefit from their humble inheritance. The ideas these organizations promote are so foreign to them that Ukrainians ignore them. “Inkliuziya” (inclusion) campaigns are increasingly benefit special-needs people.
pro-Russian political parties. After all, even under Soviet Marxism, a woman was expected to be married, have one or two children, and make a home. There is something to be said for the idea that Ukraine was better off in the Soviet Union. It’s hard to compare two societies so different, but that view is supported by the long lines of visa seekers every morning at the US Embassy in Kyiv, which has not shrunk in 30 years of independence.
Ukraine is a case study in how not to rebuild a nation after a collapse. It has ceded power to hostile and even parasitic oligarchs, most of whom are of foreign ethnic origins. But Ukraine’s problems are deeper. Its people spent centuries in slavery (even until 1974, when villagers were first allowed by the Soviet government to travel to cities) and have little experience of self-government or rule of law. That is a unique history for a white nation and a reminder of how diverse our race is.
Our best hope for Ukraine is that the killing between whites in Donbass — who once sang the same Soviet anthem — will end, and that Ukraine’s demographic hemorrhage will stop to allow for renewal and economic improvement.
I hope someday to see the British and Germans traveling to Ukraine for safe investments rather than the current spectacle of foreigners seeking exploitation.
SUPREME COURT SHREADING BIDEN’S EXECUTIVE ORDERS
U.S. Supreme Court says Biden administration must comply with ruling to restart “remain in Mexico” program for asylum-seekers
The “remain in Mexico” policy known as Migrant Protection Protocols requires many asylum-seekers to wait outside the United States for their cases to be decided.
BY ROBERT BARNES, THE WASHINGTON POST AUG. 24, 20217 PM CENTRAL
Sign up for The Brief, our daily newsletter that keeps readers up to speed on the most essential Texas news.
The Supreme Court on Tuesday said the Biden administration must comply with a lower court’s ruling to reinstate President Donald Trump’s policy that required many asylum-seekers to wait outside the United States for their cases to be decided.
The administration had asked the court to put on hold a federal judge’s order that the “remain in Mexico” policy known as Migrant Protection Protocols (MPP) had to be immediately reimplemented. U.S. District Judge Matthew Kacsmaryk ruled earlier this month that the Biden administration did not provide an adequate reason for getting rid of the policy, and that its procedures regarding asylum-seekers who enter the country were unlawful.
The Supreme Court Will Allow Evictions To Resume. It Could Affect Millions Of Tenants
The U.S. Supreme Court has blocked the Biden administration’s order extending the federal eviction moratorium to a large swath of the country, in a decision expected by both legal scholars and the White House.
The ban on evictions, a two-month order, was issued by the Centers for Disease Control and Prevention. The pause covers parts of the United States that are experiencing what the CDC calls “substantial” and “high” spread of the coronavirus.
The unsigned decision from the court was 6-3, with the court’s three liberal justices dissenting.
The court’s majority said the CDC exceeded its authority with the temporary ban.
The majority opinion says that the CDC for its order relied on “a decades-old statute that authorizes it to implement measures like fumigation and pest extermination.”
“It strains credulity to believe that this statute grants the CDC the sweeping authority that it asserts,” the majority writes, adding: “If a federally imposed eviction moratorium is to continue, Congress must specifically authorize it.”

John Moore/Getty Images
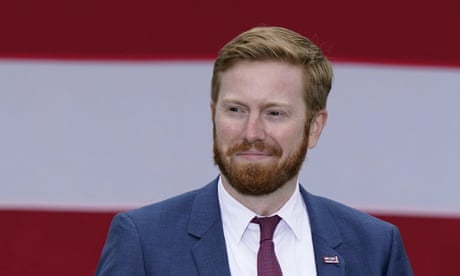
MINNESOTA’S FINEST -“BURN IT ALL DOWN”

Thompson is married and has three children, including an adult child. He developed a friendship with Philando Castile in 2005 when they worked together at local schools.
In 2009, Thompson was accused of indecently exposing himself to a woman and to two children, though no charges were filed.[11] On July 21, 2021, a Hennepin County jury convicted Thompson for misdemeanor obstruction pertaining to a 2019 disturbance incident at North Memorial Hospital in Robbinsdale, Minnesota.[12] He was given a 30-day stayed sentence to avoid jail time if he did not commit another offense and was also ordered to pay a $200 fine and $78 fee.[13][12]
Traffic stop and residency issue[edit]
In July 2021, a Saint Paul Police Department sergeant conducted a traffic stop of Thompson’s vehicle for the lack of a front license plate.[14] After presenting a Wisconsin state identification card, he was also cited for driving with a suspended license.[15] Thompson later stated that he was racially profiled and “got a ticket for driving while black”. The traffic stop incident raised questions about Thompson’s residency—whether he was a resident of the Minnesota or Wisconsin. Prior to the traffic stop, Thompson had said that he had resided in Saint Paul, Minnesota, for 18 years.[18]
Domestic assault allegations[edit]
In the aftermath of the traffic stop incident, news media reported that three different police departments had investigated a total of five domestic assault cases from 2003 to 2011 allegedly committed by Thompson. Several state officials subsequently called on Thompson to resign from the legislature, including Governor Walz, Lt. Governor Peggy Flanagan, House Speaker Melissa Hortman, House Majority Leader Ryan Winkler, and Democratic-Famer-Labor Party Chair Ken Martin. Thompson denied he had committed assault and said he did not intend to resign.
Dem Candidate Threatens To Burn Down Hugo, MN at BLM Protest: “You Think We Give A Fuck?”
ALPHA NEWS: Footage of Saturday’s protest in Hugo, Minnesota captured by Alpha News shows DFL legislative candidate John Thompson beating effigies of Bob Kroll and his wife on their front driveway.
Hundreds of Black Lives Matter protesters gathered outside Kroll’s home Saturday to protest his support for the officers involved in the death of George Floyd, whom he believes were fired without due process.
Kroll leads the Minneapolis police union and is a vocal supporter of President Donald Trump, while his wife, Liz Collin, is an anchor for WCCO. Activists have called for both Kroll and Collin to be fired from their jobs.
PSEUDO PALESTINIANS NEVER GIVE UP
Always willing to dig their own grave, now they have reached the depths of the Dead Sea by attempting to rewrite history going back 5000 years.
Woke history hits Middle East as Palestinians accused of erasing history
Palestinians seek to erase Jewish history, defining Israelis as ‘Zionist thieves,’ critics say
Palestinian leaders and their western supporters on the political Left are now re-interpreting biblical history amid a wider expansion of woke activism in the Middle East, critics say. The Palestinian Authority (PA), emboldened by some in Europe and United Nations bodies, are looking to dismantle Judeo-Christian ties to the Holy Land as they seek to invent a new narrative favoring their claims on the region, opponents of the campaign argue.
“The PA’s erasure of Jewish history combined with the inventing of a Palestinian history is used by the PA to define Israelis as ‘Zionist thieves,’ ‘usurpers,’ ‘foreigners,’ ‘invaders,’ ‘colonialists,’ in short people with no connection to the land who therefore must be defeated and expelled,” Itamar Marcus, director of Palestinian Media Watch, an Israeli-based organization researching Palestinian society, told Fox News.
Marcus points to the many historically inaccurate statements made by senior PA officials, including President Mahmoud Abbas, who in a 2016 claimed during a televised speech on Palestinian TV that, “our narrative says that we were in this land since before Abraham. I am not saying it. The Bible says it. The Bible says, in these words, that the Palestinians existed before Abraham. So why don’t you recognize my right?”
ASSOCIATED PRESS: PALESTINIAN ‘ACTIVISTS’ LAUNCHED INCENDIARY BALLOON ATTACK FROM GAZA ON ISRAEL
A series of questions sent to Abbas’ spokesman and the Palestinian Mission to the U.N. were not returned for comment.
Jerusalem has and continues to be the main flashpoint in the fight to erase history. Senior Palestinian leaders summarily dismiss Judaism’s holiest site, The Temple Mount, as an “alleged Temple.” Ze’ev Orenstein, director of International Affairs for the City of David, an archeological site for ancient Jerusalem, told Fox News, “There is no place in the world which holds more significance for more people than Jerusalem. Yet, today, both the U.N. and Palestinian leadership are seeking to erase the Jewish and Christian heritage of Jerusalem.”
“Every single day, archaeological excavations in the City of David – the place where Jerusalem began…are affirming not simply as a matter of faith, but as a matter of fact, the millennia-old connection of Jews and Christians to Jerusalem,” Orenstein added. “This includes the discovery of millennia-old inscriptions affirming biblical events; ancient seals with the names – in Hebrew – of figures straight out of the pages of the Bible, including that of the biblical King Hezekiah – direct descendant of King David from 2,700 years ago.”
Orenstein says that by visiting the City of David, people can witness this history “with their own eyes, touch with their own hands, and walk upon with their own feet.”
Yet, while the erasure campaign is especially charged around Jerusalem, Regavim, an Israeli nongovernmental organization, warns that the cradle of Jewish history has been under constant attack for years.
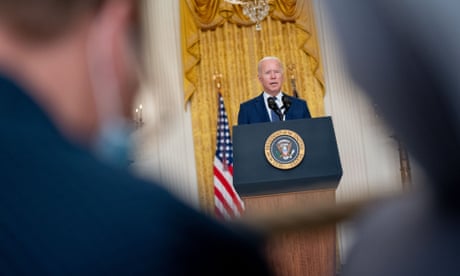
BIDEN MEETS WITH ISRAELI PRIME MINISTER AFTER DEADLY KABUL BOMBINGhttps://5b818e7bf254017b79ff3d58022128a8.safeframe.googlesyndication.com/safeframe/1-0-38/html/container.html
“The Palestinian Authority has undertaken a very carefully and purposefully orchestrated program of historical revisionism, in an attempt to blur and eventually erase the Jewish connection to the Land of Israel,” Naomi Kahn, Regavim’s international spokesperson, told Fox News. “Because Judea and Samaria are the cradle of Jewish history, these areas are quite naturally the focal points of this insidious campaign.”
She said, “The Palestinian Authority and its supporters have proven willing, even eager, to destroy the physical remains of thousands of years of Judeo-Christian culture in an attempt to make way for a fictitious quasi-historical narrative that supports their political agenda.”
Kahn said the Oslo Accord made it clear that the Palestinian Authority had to protect sites of Judeo-Christian significance and that the PA “was required to protect and enable free access – for worship, study, tourism and scientific exploration.” The “PA has completely disregarded these requirements,” she said.
Kahn gave these examples:

Photo credit Regavim (Regavim)
Sebastia is the name the Romans gave to Samaria and the capital city of the Northern Israelite Kingdom founded in the 9th century B.C. It is now an official Palestinian tourism site, but Regavim claims that visitors will hear no mention of its Jewish connection, including its being an independent Jewish kingdom of which Samaria was the seat of government.
THE LARGEST CROWDFUNDED TV SERIES IN HISTORY IS ABOUT JESUS
In the same area, Regavim said there once stood a Byzantine structure purporting to be the burial place of St. John the Baptist’s head, but added that the structure has been destroyed and defaced. It now lies in ruins. Regavim says other cathedrals that were turned into mosques in Sebastia have been reinterpreted in PA tourism guides. Regavim said it had identified over 300 such sites “that have been looted, damaged or totally decimated or are in the process of being wiped out.”
SEE PREVIOUS POSTS BELOW
JERUSALEM, ISRAEL
From a letter to the Editor of the Wall Street Journal published December 30, 2017.
“If I forget you, O Jerusalem, may my right hand forget its skill. May my tongue cling to the roof of my mouth if I do not remember you, if I do not consider Jerusalem my highest joy.” These words in Psalm 137: 5-6 written long before the birth of Muhammad, attest to the reality that Jerusalem has been Israel’s capital for millennia. I did not vote for President Trump, but I applauded his willingness to put his money where past presidents have only put their mouths in relations to Jerusalem.
Signed, Linda K. Gragg
Kennewick, Washington
Below is an article from Mitchell Bard, written many years ago when Arafat and Sharon were still living.
Today, the Palestinians could be enjoying their 54th year of independence, or their 52nd, or their 19th, or their 3rd or the eve of their 2nd. That’s right, by my count they have had at least five opportunities to have a state beside Israel if that was their real objective, but they have chosen to hold out for a Palestinian state instead of Israel. Even today, under that “hardline, right-wing” Prime Minister Ariel Sharon, the opportunity for emancipation exists, but the Palestinians stubbornly cling to their dreams of a Palestinians state replacing Israel rather than accepting the offer to establish a state beside Israel.
The first chance for statehood was in 1947 when the UN actually created an Arab state in Palestine. It was not perfect, it was not what they wanted, but it was a state. The Zionists accepted partition even though it was a truly rotten deal for them too. Think about it. Like the Arabs, the Jews believed they were entitled to all of Palestine, and not just what was then called Palestine, but the 80% of what had been Palestine that the British lopped off and turned into Transjordan. True, the UN gave the Jews more land, but most of it was the Negev desert. The borders were indefensible, and Jerusalem was not only excluded from the Jewish state, it was to be internationalized and surrounded by the Arab state.
So why did the Jews accept such a lousy deal?
David Ben-Gurion and the other Zionist leaders recognized it was the best deal they would get. They also understood that the international community was offering legal recognition for the establishment of a Jewish state. And most important, they would now have an independent state that could be a haven to Jews from around the world, and they could build it into something greater.
Most Palestinian Arabs, on the other hand, believed Palestine really was just southern Syria. They were convinced by their Arab brethren that they had no need to compromise because the Jews would be driven into the sea and they would have the entire country. The whole refugee issue is proof that most Palestinian Arabs were not even prepared to fight for their independence; they chose to flee instead. And so their chance for statehood was squandered.
The Palestinians actually had 19 years to demand statehood during the Jordanian occupation from 1948-1967. Jordan annexed the West Bank in 1950 rather than grant the Palestinians independence. What is remarkable is that there were no Hanan Ashrawis demanding the end to Jordanian occupation and the creation of a Palestinian state for all those years. Ask a Palestinian today about that and you’ll hear a lot of hemming and hawing. They only discovered a passion for independence after Israel captured the territories in 1967.
The third opportunity for statehood was presented by yet another “fanatical, right-wing” Prime Minister, Menachem Begin. In fact, when the Palestinian state comes into being, as it inevitably will some day, Begin should be regarded as its true founder. Begin was the first one to offer the Palestinians control over their own affairs. Yes, the autonomy plan that came out of the Israeli-Egyptian peace negotiations was limited, and did not offer immediate statehood, but there is no question that once the Palestinians began to control their own affairs, it would be impossible for Israel to stop them from ultimately becoming totally free of Israeli control. From about 1983 on, it was no longer a question of if there would be a Palestinian state, but when. Had the Palestinians accepted Begin’s offer, however, they would have had their state long ago.
The Oslo agreements were specifically geared toward an Israeli withdrawal from the territories and the creation of a Palestinian state. According to the timetable, the last remaining issues should have been resolved by 1999, but the Palestinians never lived up to the commitments they made, starting with the recognition of Israel and renouncement of terrorism that Arafat declared in September 1993 that was the basis for the entire Oslo process. Had Arafat ended the violence and complied with his treaty commitments, the Palestinians would be completely under Arafat’s control today (as it is 98% of the Palestinian people are under his autocratic control).
Finally, the Palestinians were offered a state by Ehud Barak in the negotiations at Camp David and the White House in 2000. Today, they could be living in a Palestine comprised of 95% of the West Bank, 100% of the Gaza Strip, and most of Arab east Jerusalem. They would have greater control of the Temple Mount and an unimpeded highway between Gaza and the West Bank. Instead, most of their cities are under curfew and surrounded by Israeli forces because Arafat rejected Barak’s offer and waged a war of terror in hopes of achieving his dream of liberating all of “Palestine.”
The best chance for the Palestinians to achieve statehood in the short-run would be to tell Ariel Sharon they are now prepared to end the violence, replace Arafat, and negotiate. They should offer to accept whatever deal Sharon offers even if it means a Palestinian state the size of a postage stamp. Why? For the same reason the Zionists accepted a state that was little more than a postage stamp.
Think about it. After agreeing to make peace with Israel, within a nanosecond of declaring statehood, the United States will recognize the new state. The rest of the world will follow suit. Within a few minutes, the Americans and Europeans will begin throwing so many dollar bills at the Palestinians that they’ll think that it’s a plague of locusts. If the Palestinians truly wish to live in peace, they can spend the next 50 years building their state, developing an economy, infrastructure, governmental institutions, and all the rest, and the world will cheer and do everything to help them. Israel will be first in line with assistance.
The great thing from the Palestinian perspective is that they don’t even have to give up their goal of destroying Israel. They just need to exercise some patience. As soon as they’re independent, they can have Karine-A’s docking nonstop at Gaza port bringing in tons of weapons. In 50 years, then, they may be strong enough to drive the Jews into the sea.
But Israel won’t allow this, you say. Even the far left in Israel has only been willing to allow the Palestinians a demilitarized state. This shows how naive they truly are. Once Palestine is independent, Israel cannot enforce this. Sure, Israel will do everything possible to prevent the large scale importation of weapons, and will interdict shipments of arms, and maybe have to conduct an Osirak type raid if necessary, but there will be a limit to what Israel can do. I still believe Israel can defend itself, because it will do whatever is necessary to insure its security, as will the Jordanians, by the way, who have just as much incentive as Israel to insure the Palestinian state is as small and weak as possible to insure the Palestinians don’t repeat their 1970 effort to take over their country.
President Bush has now offered the Palestinians a sixth opportunity for statehood. Will they finally abandon their dreams of liberating all of Palestine and choose the path of compromise rather than extremism? Will they devote their energy to building a state of their own rather than try to destroy the state of the Jews?
What do you think?
FROM TIP:Posted by Tip Staff – December 28, 2016
In a speech at the State Department on Wednesday, Secretary of State John Kerry cast the majority of the blame on the lack of Israeli-Palestinian peace on the Israelis, ignoring Israel’s history of repeatedly making risky overtures for peace with the Palestinians, only to receive terrorism in response.
Israelis voted in Labor’s Ehud Barak to the premiership in 1999 specifically because he promised to make peace with the Palestinians; in 2000, he met with then-PLO Chairman Yasser Arafat at Camp David and offered the Palestinians 92% of the West Bank, all of the Gaza Strip, and eastern Jerusalem as its capital. Israel even proposed that a maximum of 100,000 refugees would be allowed to return to Israel on the basis of humanitarian considerations or family reunification, and an international fund would be created to compensate the Palestinians. Arafat rejected the offer. Sweetening the deal, the Clinton administration suggested that the Palestinians control 97% of the West Bank and the entirety of the Gaza Strip, with a land-link between the two, as well as a capital in East Jerusalem. Barak endorsed the Clinton Parameters; again, Arafat rejected them. After having rejected Israeli peace offers at Camp David with no counter-offers of his own, Arafat chose to launch the murderous Second Intifada, killing more than 1,500 Israelis between 2000 and 2005.
In 2005, Israel withdrew from the Gaza Strip, only for that territory to be taken over by Hamas in a Palestinian civil war in 2007. Ever since, Hamas has used the Strip as a base from which to launch attacks on Israelis, using rockets and underground tunnels, and Gazans live under the grip of Hamas’ authoritarian rule.
In 2008, then-Israeli Prime Minister Ehud Olmert offered Palestinian Authority President Mahmoud Abbas 93.7% of the West Bank; the remaining 6.3% would be made up with land swaps. He also offered to take in 5,000 refugees over five years; an international committee to oversee Jerusalem’s holy sites; and an international fund consisting of billions of dollars, administered by Norwegians, to compensate Palestinian refugees. In a May 2009 interview with The Washington Post, Abbas admitted that he had turned down the offer and said, “The gaps were wide.”
The government of Israeli Prime Minister Benjamin Netanyahu agreed to an unprecedented 10-month freeze in settlement construction in November 2009 only for the Palestinians to say it was insufficient and then call for an extension when it expired. Netanyahu said he would do so if the Palestinian Authority recognized Israel as the Jewish state; the PA refused.
When the Obama administration proposed a framework for a peace agreement in 2013, the Netanyahu government accepted it, while the Palestinians turned it down. Even still, Israel was willing to talk with the Palestinian Authority, until Fatah and Hamas announced a unity government in April 2014. Hamas refuses to reject violence and terror against Israel and Israel refuses to negotiate with it. The Palestinians adopted a policy of trying to skirt direct negotiations and internationalizing the conflict via the United Nations and other international fora.
THE BIG LIE CONTINUES
Millions of people have fallen for the greatest lie of the twenty first century; it found its birth 50 years ago. The lie, “there are a Palestinian people.” History says otherwise. A country was never named Palestine. During the past 2000 years there were never a people called Palestinians. However, in 1967 Arabs who resided in Israel, the West Bank (Samaria and Judea) and Gaza began to call themselves Palestinians.
The name Palestine was a new name given to the country of Israel by Roman Emperor Hadrian. It was punishment for the Israeli revolt which started in 70AD and lasted until 135AD. The name has endured for the past 2000 years. So the question remains, where did all of those Palestinians of today come from?
To quote Mark Twain, who visited Israel in 1880? He described what he saw in three words, “Palestine is desolate.” The Holy Land was occupied by the Ottoman Turks in the 1800’s; they settled Turks in Palestine to farm and strip the forests for Turkish export. From 1840 to 1920 the Turks brought in 506,000 Arabs. In 1920 The British Mandate approved by the League of Nations in 1922 opened the floodgates to more foreigners. The British allowed 36,000 Syrians to enter the land in 1934. From 1924-1947 the British secretly brought in 440,000 Arabs from Jordan, Syria, Egypt, Lebanon and Iraq. During the Holocaust, the British smuggled in 200,000 more Arabs.
Of the 1,303,000 Arabs living in Palestine in 1947, 1 million were illegally brought in and the other 300,000 were born to those brought in after the Zionist movement in 1882 was born. The lie continues to this day. One question remains to be answered; why is the western media continuing the perpetration of this lie?
CLICK HERE FOR MORE INFORMATION ON JAFFA – TEL AVIV

Seal of the Jewish community of Jaffa (1892), bearing the biblical phrase: “Unto the Great sea shall be your coast”
Jaffa or Yafo is the southern and oldest part of Tel Aviv-Yafo, an ancient port city in Israel. Jaffa is famous for its association with the biblical stories of Jonah, Solomon and Saint Peter as well as the mythological story of Andromeda and Perseus, and later with oranges.
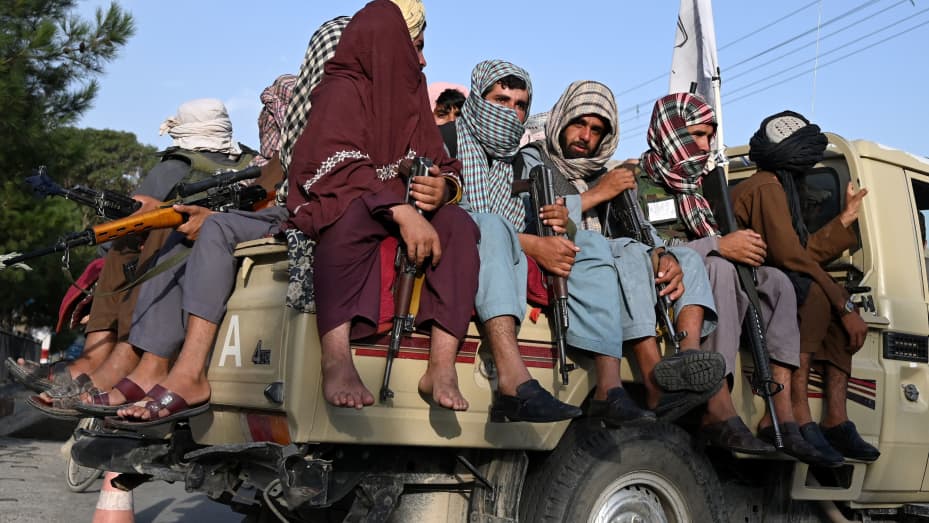
RED ALERT – TALIBAN DISGUISED AS AFGHANS ENTERING THE COUNTRY
Biden is resettling upwards of 50,000 Afghans into the United States. See below, Biden doesn’t even know how many Americans are still in Afghanistan. Is he for real. And this guy Sullivan, another doofus. There is no vetting process here; even if there was, these Afghans hate us. Sure they worked AS SCOUTS and INTERPRETERS, but not because they liked us, they did it for the money. What will happen here, and we say quickly, they will be recruited by the likes of Tlaib (impeach the mother fucker) and Omar (see bleow). Both are suicide bombers in their own right.
- ENGAGING WITH THE ENEMY. DO YOU BELIEVE THIS? The U.S. is in close coordination with the Taliban as it works to evacuate tens of thousands of people from the Kabul airport before Aug. 31, National Security Advisor Jake Sullivan said.
- “We are engaging with the Taliban, consulting with the Taliban, on every aspect of what’s happening in Kabul right now,” Sullivan said.
- The U.S.-led international effort to get people out of Afghanistan has picked up pace in the last 24 hours.
- So they tout the fact that our drone stopped another suicide attack today. “Big F’n deal” 170 got killed on the first one. Where was Biden then. Stupid question. He was hold up in his rat hole.
Sullivan defended the Biden administration from critics who say the chaotic and often tragic scenes that have played out in and around the Kabul Airport in the past week could have been avoided with better planning and execution.
Sullivan said an element of chaos was inevitable in any U.S. withdrawal.
“Whether Kabul fell in August or September, or December or next August, the fact is, there were going to be American citizens in Kabul who needed to be evacuated,” he said.
Nonetheless, “we believe that we have time, between now and the 31st, to get out any American that wants to get out” of Afghanistan.
U.S. officials provided Taliban with names of Americans, Afghan allies to evacuate

The White House contends that limited information sharing with the Taliban is saving lives; critics argue it’s putting Afghan allies in harm’s way.

The decision to provide specific names to the Taliban, which has a history of brutally murdering Afghans who collaborated with the U.S. and other coalition forces during the conflict, has angered lawmakers and military officials. | Master Sgt. Donald R. Allen/U.S. Air Force via AP
By LARA SELIGMAN, ALEXANDER WARD and ANDREW DESIDERIO
08/26/2021 03:28 PM EDT
Updated: 08/26/2021 09:48 PM EDT
U.S. officials in Kabul gave the Taliban a list of names of American citizens, green card holders and Afghan allies to grant entry into the militant-controlled outer perimeter of the city’s airport, a choice that’s prompted outrage behind the scenes from lawmakers and military officials.
The move, detailed to POLITICO by three U.S. and congressional officials, was designed to expedite the evacuation of tens of thousands of people from Afghanistan as chaos erupted in Afghanistan’s capital city last week after the Taliban seized control of the country. It also came as the Biden administration has been relying on the Taliban for security outside the airport.
NBC News blames Trump for ISIS-K attack in Afghanistan
NBC News blamed former president Donald Trump for the ISIS-K attack in Afghanistan Thursday that took the lives of 13 U.S. service members, injured 20 more, and killed even more Afghan citizens.
An article written by NBC military writer Sebastien Roblin said it may be “easy” to blame President Biden for the attack, but the “architecture” of the withdrawal of U.S. troops from the region was built by Trump.
“The rushed evacuation and its vulnerability to Thursday’s deplorable attack were inevitable outcomes of the rapid collapse of the Afghan government,” Roblin wrote.
Ilhan Omar files unusual financial disclosure report
Omar’s most recent personal disclosure lists only five assets, four of them belonging to her husband. Notably, the disclosure lists the congresswoman’s husband’s earned income from his six to seven-figure job as a partner at political consulting firm eStreet Group, but does not appear to list any of the congresswoman’s personal bank accounts.
Omar’s bank account is an asset required to be disclosed, according to federal law, with her personal financial disclosure listing a pair of money market accounts.
The Minnesota Democrat’s latest lacking disclosure appears to be the newest instance in her lackluster financial reporting.
Omar also appears to have failed to disclose her bank account in both her 2018 and 2019 financial disclosures, suggesting a potential unethical pattern in what she is disclosing to the public.
Omar’s campaign paid eStreet Group $3.7 million over the 2020 cycle, according to campaign filings, contributing four-fifths of political payments to her husband’s firm during the election cycle.
https://0df8ab7eedf7a9c4c186fb5b6addb6e8.safeframe.googlesyndication.com/safeframe/1-0-38/html/container.html
HOW IS IT THAT THIS PIECE OF HUMAN ESCREMENT IS IN THE HOUSE OF REPRESENTATIVES? A SOMALI CRIMINAL RAPING THE UNITED STATES. ARE YOU AS OUTRAGED AS MUCH AS WE ARE?