The H-1B is a visa in the United States under the Immigration and Nationality Act, section 101(a)(17)(H) which allows U.S. employers to employ foreign workers in specialty occupations. If a foreign worker in H-1B status quits or is dismissed from the sponsoring employer, the worker must either apply for and be granted a change of status, find another employer (subject to application for adjustment of status and/or change of visa), or leave the United States. Effective January 17, 2017, USCIS modified the rules to allow a grace period of up to 60 days but in practice as long as a green card application is pending they are allowed to stay. In 2015, there were 348,669 applicants for the H-1B filed of which 275,317 were approved.
The regulations define a “specialty occupation” as requiring theoretical and practical application of a body of highly specialized knowledge in a field of human endeavor including but not limited to biotechnology, chemistry, architecture, engineering, mathematics, physical sciences, social sciences, medicine and health, education, law, accounting, business specialties, theology, and the arts, and requiring the attainment of a bachelor’s degree or its equivalent as a minimum (with the exception of fashion models, who must be “of distinguished merit and ability”). Likewise, the foreign worker must possess at least a bachelor’s degree or its equivalent and state licensure, if required to practice in that field. H-1B work-authorization is strictly limited to employment by the sponsoring employer.
On March 3, 2017 the U.S. Citizenship and Immigration Service announced on their website that starting from April 3, 2017 they would temporarily suspend premium processing for all H-1B visa petitions until further notice. On April 18, 2017 President Trump signed a “Buy American, Hire American” Executive Order which sets broad policy intentions directing federal agencies to propose reforms to the H-1B visa system.
The raison d’être for American companies to request H-1B visas for foreign subjects is two fold. One, the companies find it cheaper to hire a foreigner and number two, companies can’t find Americans with similar qualifications. This seems odd at first look, but once delved into the reason is crystal clear.
Adding to the chaos are the number of STEM visas which have risen at a parabolic rate during the past couple of years. It is important to note that almost 60% are from China and India.
On the home front less than 3.5% of college graduates majored in computer sciences and information technologies. These are technologies targeted by foreign countries. This is a sad story, but one that has to be told. Many factors play a part in this dismal statistic, but there is one standout; our education system does not have the discipline needed to keep up with the rest of the world. In fact our college educated barely compete in STEM. In the next thirty years we will see the downside when the behemoths of China and India become hegemonic in the spheres of influence that matter most. Taking a myopic view one does not see what the future holds, but with foreigners leaping us by leaps and bounds it does not look good at this point in time.

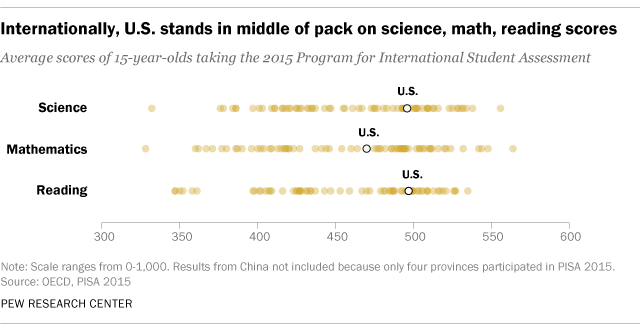
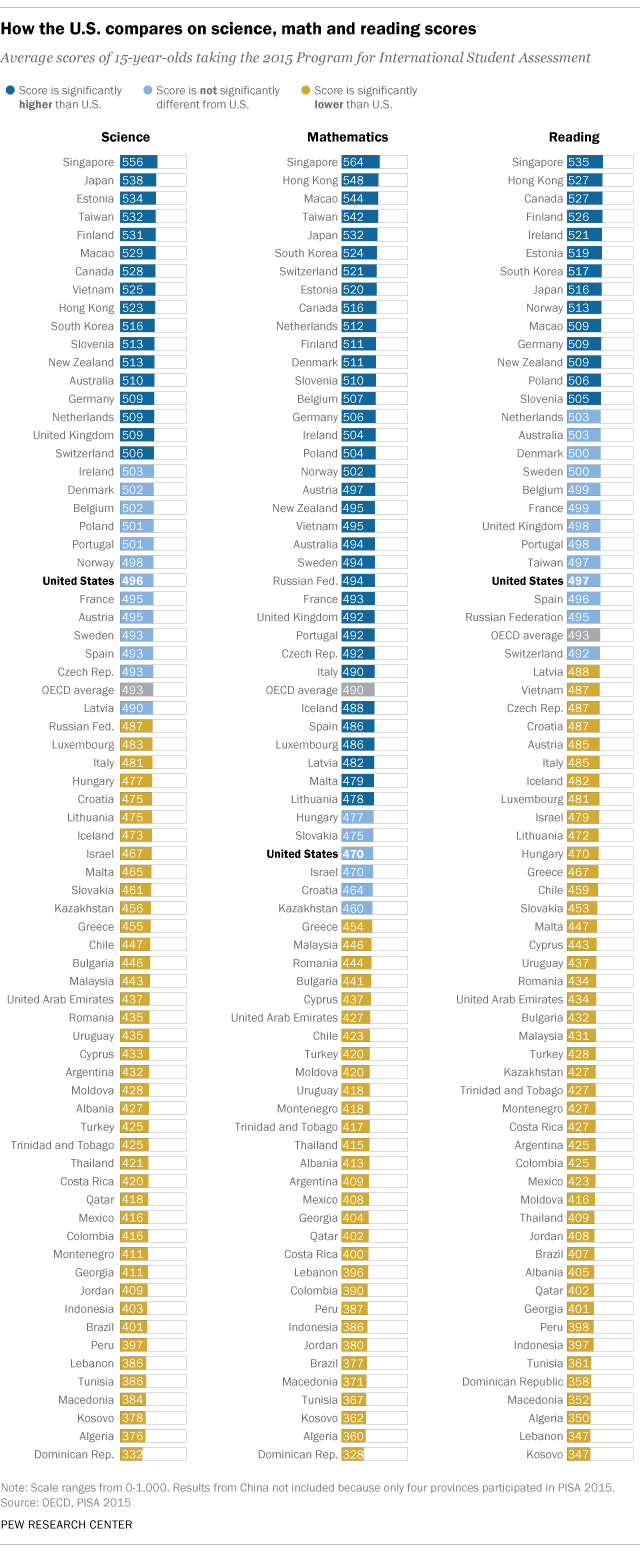
How do U.S. students compare with their peers around the world? Recently released data from international math and science assessments indicate that U.S. students continue to rank around the middle of the pack, and behind many other advanced industrial nations.
One of the biggest cross-national tests is the Programme for International Student Assessment (PISA), which every three years measures reading ability, math and science literacy and other key skills among 15-year-olds in dozens of developed and developing countries. The most recent PISA results, from 2015, placed the U.S. an unimpressive 38thout of 71 countries in math and 24th in science. Among the 35 members of the Organization for Economic Cooperation and Development, which sponsors the PISA initiative, the U.S. ranked 30th in math and 19th in science.
Younger American students fare somewhat better on a similar cross-national assessment, the Trends in International Mathematics and Science Study. That study, known as TIMSS, has tested students in grades four and eight every four years since 1995. In the most recent tests, from 2015, 10 countries (out of 48 total) had statistically higher average fourth-grade math scores than the U.S., while seven countries had higher average science scores. In the eighth-grade tests, seven out of 37 countries had statistically higher average math scores than the U.S., and seven had higher science scores.
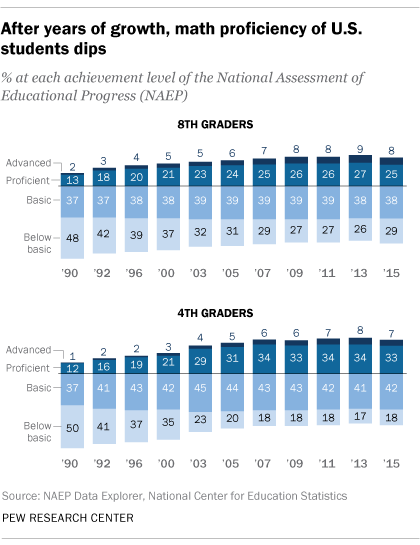
 Another long-running testing effort is the National Assessment of Educational Progress, a project of the federal Education Department. In the most recent NAEP results, from 2015, average math scores for fourth- and eighth-graders fell for the first time since 1990. A team from Rutgers University is analyzing the NAEP data to try to identify the reasons for the drop in math scores.
The average fourth-grade NAEP math score in 2015 was 240 (on a scale of 0 to 500), the same level as in 2009 and down from 242 in 2013. The average eighth-grade score was 282 in 2015, compared with 285 in 2013; that score was the lowest since 2007. (The NAEP has only tested 12th-graders in math four times since 2005; their 2015 average score of 152 on a 0-to-300 scale was one point lower than in 2013 and 2009.)
Looked at another way, the 2015 NAEP rated 40% of fourth-graders, 33% of eighth-graders and 25% of 12th-graders as “proficient” or “advanced” in math. While far fewer fourth- and eighth-graders now rate at “below basic,” the lowest performance level (18% and 29%, respectively, versus 50% and 48% in 1990), improvement in the top levels appears to have stalled out. (Among 12th-graders, 38% scored at the lowest performance level in math, a point lower than in 2005.)
NAEP also tests U.S. students on science, though not as regularly, and the limited results available indicate some improvement. Between 2009 and 2015, the average scores of both fourth- and eight-graders improved from 150 to 154 (on a 0-to-300 scale), although for 12th-graders the average score remained at 150. In 2015, 38% of fourth-graders, 34% of eighth-graders and 22% of 12th-graders were rated proficient or better in science; 24% of fourth-graders, 32% of eighth-graders and 40% of 12th-graders were rated “below basic.”
These results likely won’t surprise too many people. In a 2015 Pew Research Center report, only 29% of Americans rated their country’s K-12 education in science, technology, engineering and mathematics (known as STEM) as above average or the best in the world. Scientists were even more critical: A companion survey of members of the American Association for the Advancement of Science found that just 16% called U.S. K-12 STEM education the best or above average; 46%, in contrast, said K-12 STEM in the U.S. was below average.
 Note: This is an update of a post originally published Feb. 2, 2015. It has been updated to include more recent data.
TOPICS: EDUCATION, EDUCATIONAL ATTAINMENT, SCIENCE AND INNOVATION

Drew DeSilver is a senior writer at Pew Research Center.

